Rapid transition from El Niño to La Niña in the coming months of 2024, according to NOAA prediction
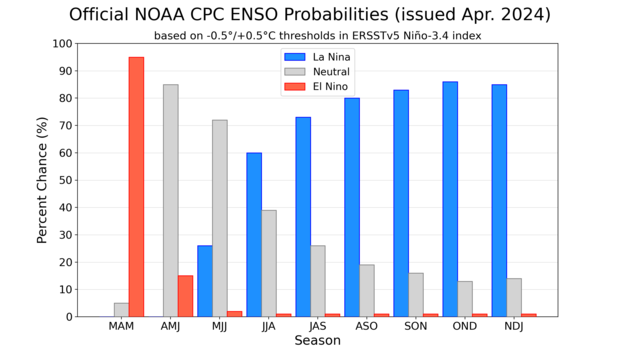
Meteorologists estimate that there is an 85% chance that El Niño will end and the tropical Pacific will move to neutral conditions for the period April-June 2024. La Niña would then appear between June and August.
According to NOAA and as of April 11, 2024, there is a 60% chance that La Niña will develop between June and August. Overall, this month's forecast is very similar to last month's and we continue to expect La Niña for fall and early winter in the Northern Hemisphere (around 85% chance).
La Niña and El Niño are opposite phases of the El Niño-Southern Oscillation climate pattern, “ENSO” for short. Like El Niño, La Niña changes oceanic and atmospheric circulation in the tropics. Those changes begin in the Pacific Ocean and then spread around the world in predictable ways. So the arrival of La Niña gives us an early idea of possible future climate conditions.
Why are our odds relatively high, even though we're still firmly stuck in the "spring predictability barrier," a time of year when forecasts are typically more complicated? What could La Niña mean for summer and autumn weather? And what could we expect from the global average surface temperature, after a record year?
Actual conditions
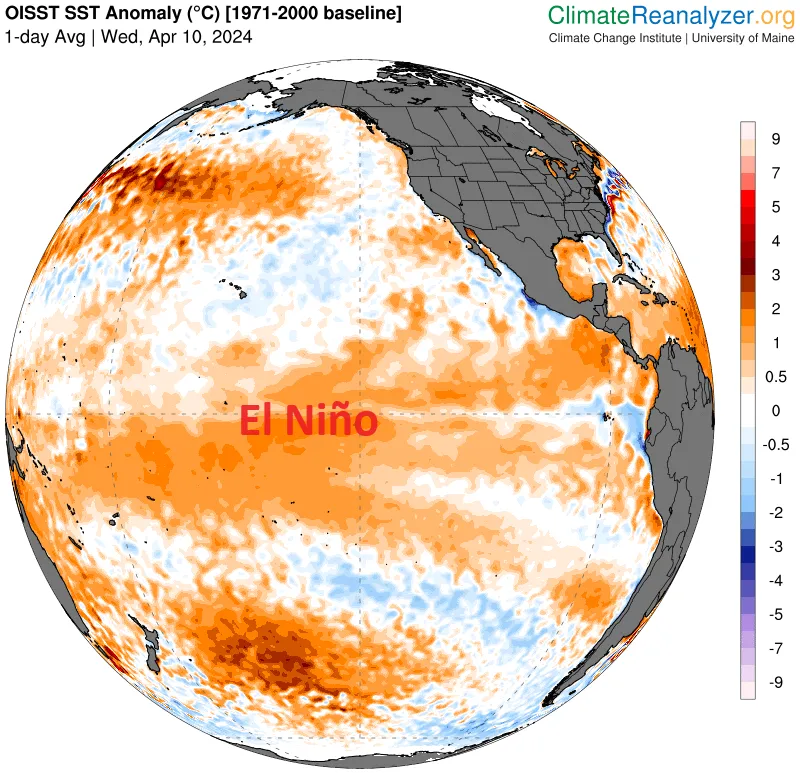
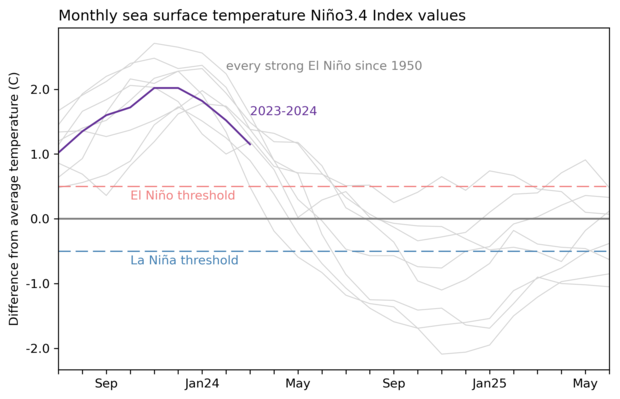
First things first: current ENSO conditions. The sea surface temperature anomaly in the Niño-3.4 region of the tropical Pacific is our main metric for ENSO (anomaly = deviation from the long-term average, in this case the long term is 1991-2020). Since the El Niño peak in November-December 2023 of approximately 2.0°C, this anomaly has been steadily decreasing, but, at 1.2°C, it is still well above the El Niño threshold of 0.5°C
However, when looking at the atmosphere over the tropical Pacific, we find that the expected El Niño pattern (weaker than average trade winds, more rain and clouds in the central tropical Pacific, drier conditions over Indonesia, reflecting an Walker's weakest) has largely changed and disappeared. This is not unexpected; As ENSO events decay, sometimes the atmosphere and ocean have slightly different schedules. (This is also the case when they start.)
This provides confidence that the warm sea surface temperature anomaly will continue to decline and will likely reach a neutral level (between 0.5 and -0.5 °C) between April and June 2024.
Changes in the depths
Further evidence can be found beneath the surface of the tropical Pacific that El Niño is likely to soon give way to a neutral state, with La Niña hot on its heels. We closely monitor water temperatures in the upper 300 metres of the equatorial Pacific because this water provides a source for the surface. Since January, two ascending Kelvin waves (droplets of colder water traveling from west to east beneath the surface) have been moving.
The most recent ascending Kelvin wave will continue to move eastward and rise, providing a source of colder than average water to the surface.
La Niña on the horizon and impacts
As mentioned above, La Niña causes changes in global atmospheric circulation, making certain temperature and precipitation patterns more likely. We'll delve into this a bit more after El Niño ends, but a potential La Niña impact has recently been noted.
It does this by reducing vertical wind shear (the change in wind from near the surface to high in the atmosphere) over the Atlantic Ocean, which facilitates the growth of hurricanes. Considering that the tropical Atlantic Ocean is already very warm, you can bet that NOAA's hurricane forecast team is paying close attention to the likelihood of La Niña.
Very warm waters
Speaking of the waters of the Atlantic, let's return to the topic of global average surface temperature.
The warmer than average tropical Pacific of El Niño tends to contribute to higher global average surface temperatures, while the cooler tropical Pacific of La Niña generally contributes to relatively colder years. However, the emphasis is on the relative, as the most recent La Niña events are among the ten warmest years on record.
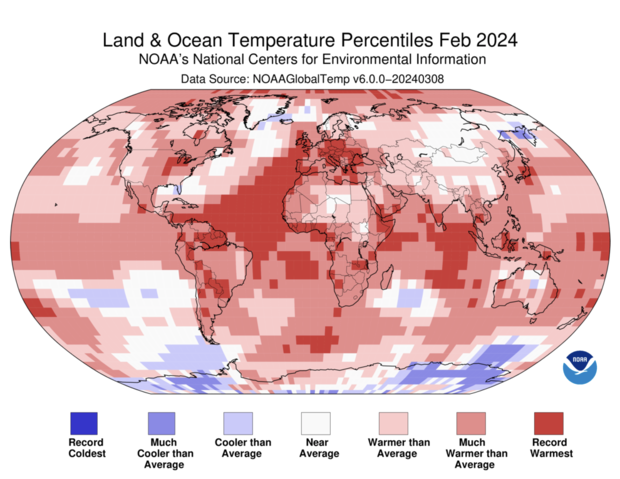
As with ENSO, we track the global surface temperature anomaly as the deviation from the long-term average. Unlike ENSO, different researchers and in different situations use some “long-term” base periods, including 1991-2020 (recent normal), 1901-2000 (the 20th century), and 1850-1900 (the period before the normal era). industrial era). However, as long as attention is paid to the base period being used, the message remains the same: the global average temperature anomaly is breaking records.
According to NOAA's National Center for Environmental Information, “the global surface temperature in February was 1.40°C above the 20th century average of 12.1°C, making it the warmest February on record [ dating back to 1850] and the ninth consecutive month of record global temperatures.”
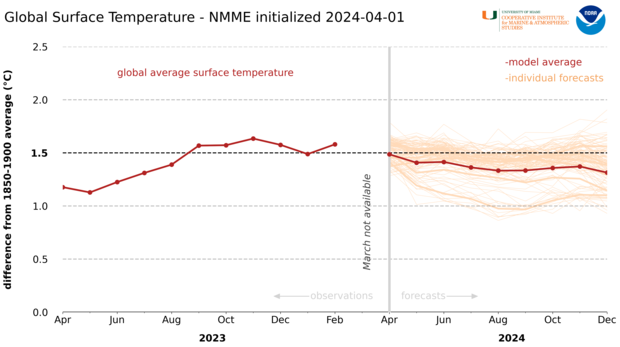
Could the development of La Niña cause the global average surface temperature to move closer to normal? Not very likely. We're just a few months away, and NCEI's Annual Global Temperature Outlook already predicts “a 45% chance that 2024 will rank as the warmest year on record and a 99% chance that it will crack the top five.”
The forecast from the North American Multi-Model Ensemble (NMME), a collection of state-of-the-art climate models from US and Canadian centres, predicts only a slight reduction in the global surface temperature anomaly over the coming months. Note that the NMME prediction uses a base period of 1850 to 1900 to provide an estimate of global temperature rise relative to “pre-industrial” times.
It could be another very interesting year from a climatic point of view.
Source: NOAA Blog