
Scientists turn Starlink into a giant scanner for Earth’s upper atmosphere
Kyoto University researchers have used orbital data from roughly 1,200 Starlink satellites to map atmospheric density about 500km above Earth, which could help reduce risk of collisions in orbit
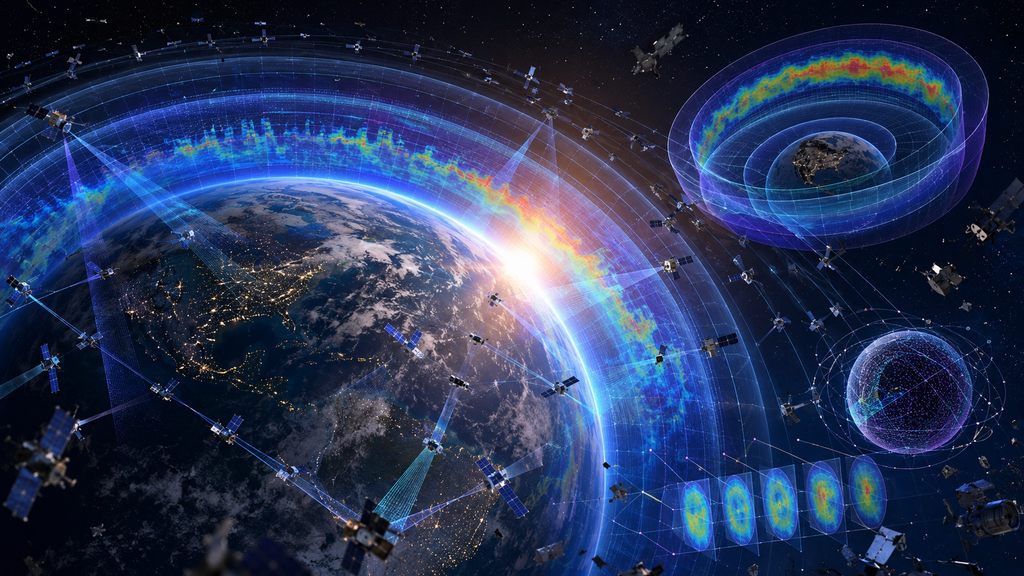
Hundreds of kilometres above Earth there's a layer of atmosphere called the thermosphere that's almost entirely made up of electrically neutral gas, which makes it notoriously difficult to measure. That's a problem because even at those altitudes, according to researchers, the atmosphere is still thick enough to drag on satellites and slow them down - and with orbits getting more crowded by the year, knowing exactly how dense it is matters for avoiding collisions.
Now, a team at Kyoto University found a way around the measurement problem by borrowing a technique from medicine.
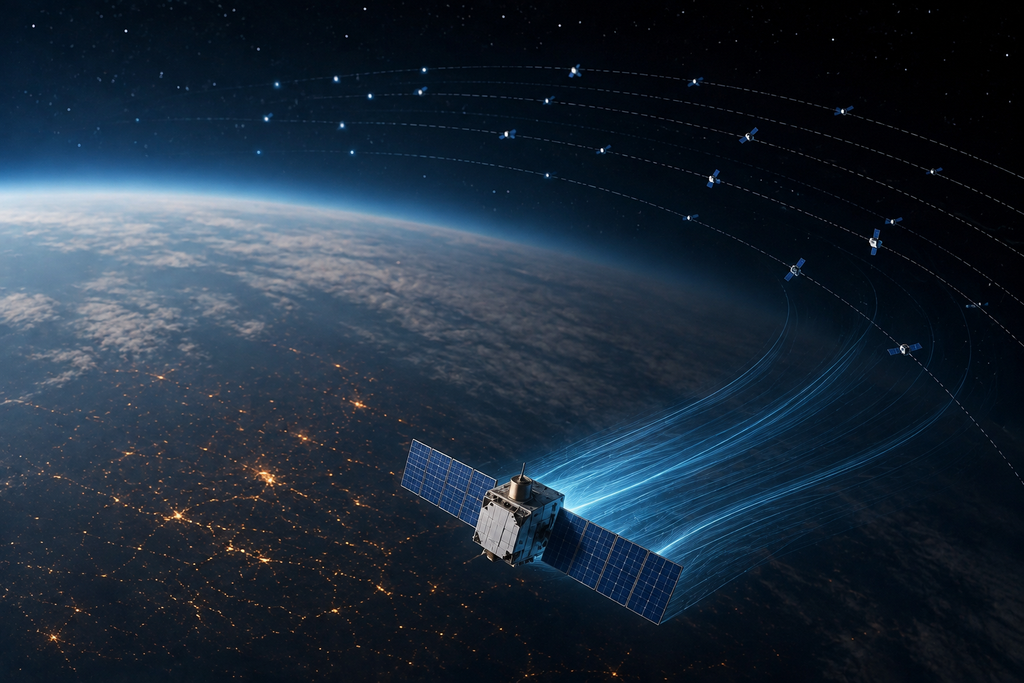
Taking publicly available orbital data from about 1,200 Starlink satellites flying at around 482 kilometres, they applied something called tomography - the same principle behind CT scans - to work out how dense the atmosphere was around them based on how much drag was slowing each satellite down.
Using medical imaging techniques on the sky
From the data they collected, the scientists built what they're calling is the "first two-dimensional latitude-longitude snapshot" of thermospheric density at roughly 500km altitude.
The patterns they found matched up well with independent observations from the European Space Agency's SWARM satellites, which gave them confidence the method was working.
"This is a multidisciplinary study between space science and space engineering," said corresponding author Mamoru Yamamoto.
"Reading papers from both research fields, we realised that deeper dialogue between researchers from both fields is necessary."
The study builds on earlier work by the same group where they'd tracked how density changed over time and altitude using Starlink data. But what's new in this step is that it adds the horizontal picture - how density varies across different parts of the globe - which hadn't been done before using this approach, according to the researchers.
Why it could matter for everyone with a satellite
TAccording to the team, there's an upside and it's quite a practical bonus. That arrives in the better atmospheric density data means better predictions of where satellites are going to be. And better predictions mean fewer near-misses and collisions in orbits that are getting more packed by the year.
In the future, the researchers say the technique could support something close to real-time monitoring of atmospheric conditions around satellites. This, they say, would feed into space weather forecasting and make satellite operations generally safer and more predictable.
News reference
Kyoto University/ScienceDaily. (2026). Scientists turn Starlink into a giant scanner for Earth's upper atmosphere.